
What's in a number?
Sometimes, much less than in a name

Rancher Bob was sitting outside on the porch, cracking a beer with fellow rancher Jim from Bar-U-Six. They had a cordial conversation, as usual. Bob learnt some stuff from Jim, though, that he had never heard before. Jim mentioned that he recently had to jump a couple of hoops to get a small business loan. “We got it from Ranch Country Bank and Trust. They were willing to move forward ‘cause we’ve been doing business with them for a long time.” All right, Bob thought, at least knowing each other still means something to some businesses. Less comforting, though, was to learn why Jim had not been successful with the big banks.
“We didn’t have an FEEI,” Jim said. “That’s a future environmental expenditure index.” It’s supposed to summarize all environmental impact your ranch has and will have over the coming fifty years.” When Bob questioned if calculating such a metric is even possible, Jim answered: “Of course not, but if you employ a consultant for 25 grand a year, you can pretend it is.”

When media want to bring a topic across that boosts one or another elite agenda, they increasingly seem to build their stories around one single number. Let’s jump back to the period many no longer want to remember: the COVID pandemic. In the earliest days of the pandemic, most attention was given to assessing the severity of the outbreak. Above all, daily death counts were incessantly talked about in the news. The focus on mortality managed to instill fear into much of the broader public. It is quite strange that this was the media and the authorities’ approach, because in a really catastrophic event, one would want the average denizens to keep their cool, so as to avoid running into a nationwide panic. A fixation on death counts seems quite undesirable in such a context.
When fear had settled in and many had been convinced that extreme measures were necessary, the media narrative shifted to what needed to be done to mitigate the emergency. The answer presented was to “flatten the curve,” with “the curve” being the daily case count. We note that at that point, the daily death count did no longer seem to be as important. In many regions, it had actually subsided, which should have been an indication that it was time to get back to normal. However, case count curves were fueled by asymptomatic testing and showed astronomical numbers. So how could we ever get them down?

Parroting some of “the experts,” the media’s answer resided in one number: the reproduction number, or R. It represents the average number of persons a given infected person will pass the disease on to. The virtues of focusing on this number may seem intuitive: if it is above one, the average person will infect more than one other person and the pandemic gets worse. Conversely, if it is below one, the velocity of the spread must be slackening. Experts and media alike recognized the straightforward interpretability proffered by the R number. For almost one and a half years, media would highlight which measures to take, so R could be constrained below the beneficial boundary of one, and “the curve could be flattened.” The mediatization of the R number definitely had an effect. One poll carried out in Britain in January 2021 found that 88% of the British general public had heard of the importance of the R number, whereas 42% could explain it properly. Those numbers are impressive, considering these are interviewees of all walks of life.
The reproduction number was reported on a daily basis, most often with two decimals, which gave it a sense of scientific authority. If we know today’s R number is 1.61, we for sure also know how to lower it, don’t we? Yet in spite of all those estimates and forecasts having been made, in hindsight, the pandemic seems to have pretty much gone its own way. While creating the appearance of being in control, over-reliance on R may not have been the best strategy after all. Actually, that is the message of a five-part article series published by Gavin Freeguard throughout 2024 in Significance, the easy-to-read magazine published under the auspices of the American, Australian and Royal (i.e.British) Statistical Societies.
While R may have the appearance of a statistically sound estimate that is easy to interpret, it is in fact not so easy to obtain and even less so with actionable precision. At first, it is important to know that R cannot be measured directly. Part 2 in Gavin Freeguard’s five-part series commences with the statement:
“Since R cannot be measured directly, it can only be modelled.”
Gavin Freeguard. The story of the R number: How an obscure epidemiological figure took over our lives. Part 2: Modelling. Significance Magazine.
Indeed, R is derived using averages of epidemiological models. Each of these models are based on a set of assumptions. The quality of the model output strongly depends on the quality of the input data. Beyond the uncertainty that may be associated with the input data and may be sizable by itself, the act of modeling compounds uncertainty into the model estimates. It is thus estranging to see R reported in the news with two decimals of precision, but without any estimate of uncertainty. In fact, an estimate of 1.54 ± 0.11 might be worrisome, whereas an R number of 1.85 ± 2.15 would not be amenable to base any decision or policy upon.
All of the aforementioned limitations would already be true if we had precise, real-time data to make model predictions from. Howbeit, nothing is less true. Absolute case, hospitalization and death counts are some of the inputs into the models. To this day, there are legitimate discussions on the numbers that were reported, such as the data being aggregated by individuals who took calls from hospitals, which led to “Frankenstein data sets.” That notably also happened in countries with centralized healthcare systems. But even if the official numbers were 100% accurate, their use would still lead to many questions about the resulting estimates. In fact, neither case, hospitalization, or death counts, arrive instantaneously. They all arrive with individually varying time lags. Therefore, the R number we are looking at today may well reflect the situation from two weeks ago. To mitigate the time lag effect, forecasts can be used instead of the actual numbers. However, there is additional uncertainty associated with forecasting models, which then adds to the uncertainty in R. The difficulty to estimate R from data with individually varying time lags, is expressed in the following quote from Part 1 in Freeguard’s series:
“As Rob Challen, a member of the modelling team at the University of Exeter, puts it: ‘By the time you take into account the Friday publication [of the R number by the UK government], from data produced on Monday, referring to the previous Thursday, referring to infections which happened … even with the best will in the world, you’re generally looking at two weeks ago.’”
Gavin Freeguard, The story of the R number: How an obscure epidemiological figure took over our lives. Part 1: History. Significance Magazine.
Many lessons can be learnt from the communication based on R during the pandemic. Maybe, the most important lesson is the following. It may be enticing to reduce a set of interdependent, spatiotemporally varying and highly complex processes into a single, “simple” number. The resulting number, though, may end up being easier to mediatize than to convert into practical decisions to the benefit of the greater good.
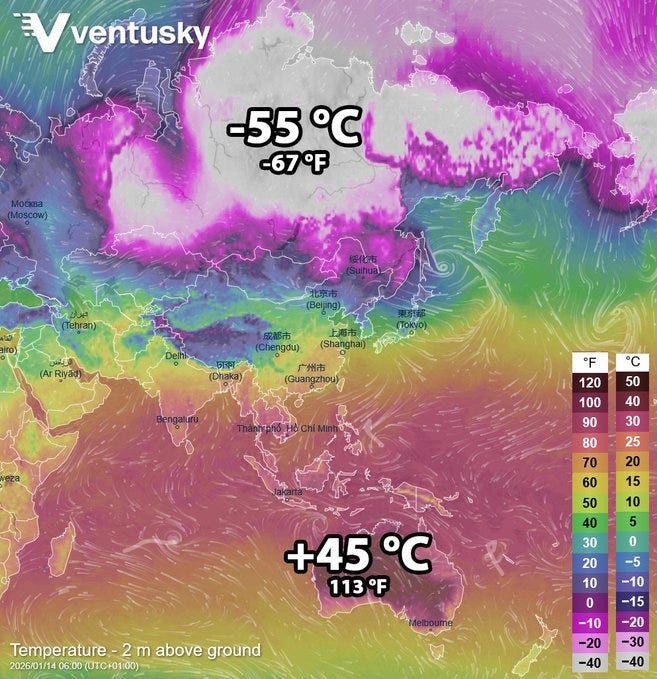
While R is a great example of the tendency to distill highly complex phenomena into just a single number, it certainly is not the only one. For more than a decade, politicians and climate activists have campaigned around doing “everything it takes” to “keep global temperature from rising more than one and a half degrees above pre-industrial levels.” While it is easy to aggregate temperature numbers from measurements around the world, the higher the level of aggregation, the less clear it becomes what the number actually means. January 14 of this year presented itself as a good example to question the meaning of the concept of “global temperature.” Temperature measurements two metres above ground reported a spread as far apart as –55 °C (–67 °F) in Siberia and +45 °C (+113 °F) in Australia. Does the global average at that time really tell us that much? The picture becomes even blurrier when those global averages need to be compared to “pre-industrial levels,” a time when far fewer and far less reliable temperature measurements were available. In this case too, that lack of data can be compensated … by modelling, which injects its own uncertainty into the final number. However, in spite of the lack of precision in the inputs, these numbers are readily processed further into climate models. Those can, on their turn, be combined with economic forecasts to yield the so-called “social cost of carbon,” which is … a single number that hugely oversimplifies both climate and economy. It is therefore understandable that individual scientific teams have come up with widely varying estimates, which can only lead to the conclusion that estimating the “social cost of carbon” is nothing more than an academic exercise devoid of utility.
(If you deem reading Wild Horse Wisdom not to be devoid of utility, please consider to subscribe. There is a free tier.)
As long as the tendency to reduce highly complex systems into a single number remains an academic exercise, it merely boils down to a waste of resources. However, each of the examples above have been used as a basis for policies. These numbers have, or have had, an impact on our lives. The R number was used in policymaking in the pandemic and led, or at least contributed, to decisions to lock countries down. Global temperature was and is still used by some to drive “net zero” policies, the only effect of which seems to be to tank domestic economy and inconvenience citizens’ lives. The “social cost of carbon” has appeared in official US government policies from three consecutive administrations.
Even worse than basing policy for a whole society on one individual metric, is to try and summarize a person into a number. However, that is what the Chinese government is doing to this day. Chinese citizens are attributed a social credit score that varies on a constant basis based on behaviour. Human beings have very complex natures. Even those who make a serious misstep often have many positive qualities. It is insane to write them off because a certain concocted number is “too low.” In fact, each human is much more than a number. It is dehumanizing to treat humans as if they ever could be summarized into one, representative number. It is therefore up to everyone to resist those practices ever being deployed on a broad scale outside China.
Our characters, environment, climate, economy and many other aspects of society are highly complex. It is highly misleading to think that any of those can reliably be summarized into nothing more than one number. Instead of using a person’s “social credit score” to judge who he is, let’s treat him as a person, talk to him and build trust. Instead of summarizing business behaviour into an “ESG” score, let’s do a detailed analysis of their financials, talk to them and build trust. The last thing we need is a “zero trust” society that uses single numerals to decide whom to engage with. Even less so if the number is being calculated or evaluated by AI. Finally, let’s also not build society-wide policies based on the short-sighted use of misleading, single-number metrics, but let’s have a civilized debate instead. In such discussions, let’s always keep in mind that
“Condensing a complicated situation to any one number is fundamentally flawed … A perfect one-number summary simply doesn’t exist.”
Prof. Samir Bhatt, Imperial College London
Prof. Samir Bhatt, a professor of statistics and public health at Imperial College London, made this comment in connection to the R number, but as we have seen, it is much more broadly applicable.

Here at the Ranch, there are certain things we count as one number. Our number of horses and cattle, for instance. That is a number that we always have in mind. What their future environmental expenditure index is, though, we don’t know. Nor do we want to know. Because over here, we still have small businesses where people meet other people who work things out together. We stay far away from anything that monitors us or decides for us what is true in an app.
Many issues in modern society are far too complex for politicians to manage, especially when they rely on a bunch of staffers to brief them on the issues. So they dumb it down into one number. In the case of global temperature anomalies, not only is the integrity of the data series questionable (over 1/2 of temperature readings from the US Climatology Station Network are estimates today because urban development has encroached on the stations that used to be in the country), but what measurements we do have show that the average temperature in the US is rising because nights are getting warmer, but daytime highs aren’t changing. If trapped outgoing radiation was the cause, one might think that the daytime temperature would be rising ….